
Intro
Clinicians read research to improve patient care, but the volume and complexity of studies can be daunting. A practical approach blends (1) quick triage to decide if a paper deserves close attention, (2) structured appraisal of internal validity, effect sizes, and relevance, and (3) sensible synthesis with existing evidence and patient preferences. Reporting guidelines such as PRISMA for systematic reviews, CONSORT for randomized trials, and STROBE for observational studies help readers see what was done and spot red flags when critical information is missing [1-3]. For deeper methods and statistics, the Cochrane Handbook and GRADE framework show how to judge certainty and translate evidence into guidance [4-5].
What counts as a “research article”?
In healthcare, peer‑reviewed articles typically fall into:
- Evidence syntheses: systematic reviews and meta‑analyses (may include network meta‑analysis) [1,4].
- Experimental studies: randomized controlled trials (parallel, cluster, crossover), pragmatic vs explanatory trials [3–4].
- Observational studies: cohort, case‑control, cross‑sectional (often guided by STROBE) [3].
- Diagnostic accuracy studies: estimate sensitivity, specificity, predictive values, and likelihood ratios; reported with STARD and appraised with QUADAS‑2 [8,10].
- Qualitative and mixed‑methods research: address experiences, acceptability, and context (often included in guideline development).
- Protocols, preprints, and trial registries: useful for transparency and discovering ongoing work, but interpret cautiously until peer review and results are available [11–12].
Where to find the literature efficiently
- PubMed/PMC: free search of MEDLINE and related content; learn filters, field tags, and MeSH to improve precision [13–14].
- Cochrane Library: high‑quality systematic reviews and robust methods [4].
- TRIP Database and Epistemonikos: fast entry points to guidelines, reviews, and synopses for clinicians [16–17,20].
- ClinicalTrials.gov: registry for ongoing and completed studies; confirm registration before first participant (ICMJE policy) and evaluate posted results carefully [11–12,28].
- USPSTF and AHRQ EPC reports: model transparent, methodologically rigorous evidence appraisals for U.S. practice [18,24].
Study designs & what they’re good for
Systematic reviews/meta‑analyses answer focused questions by collating all eligible studies with predefined methods. Look for a protocol, comprehensive search, duplicate screening/abstraction, risk‑of‑bias assessment, and appropriate synthesis with heterogeneity explored (e.g., subgroup analyses, meta‑regression) [1,4].
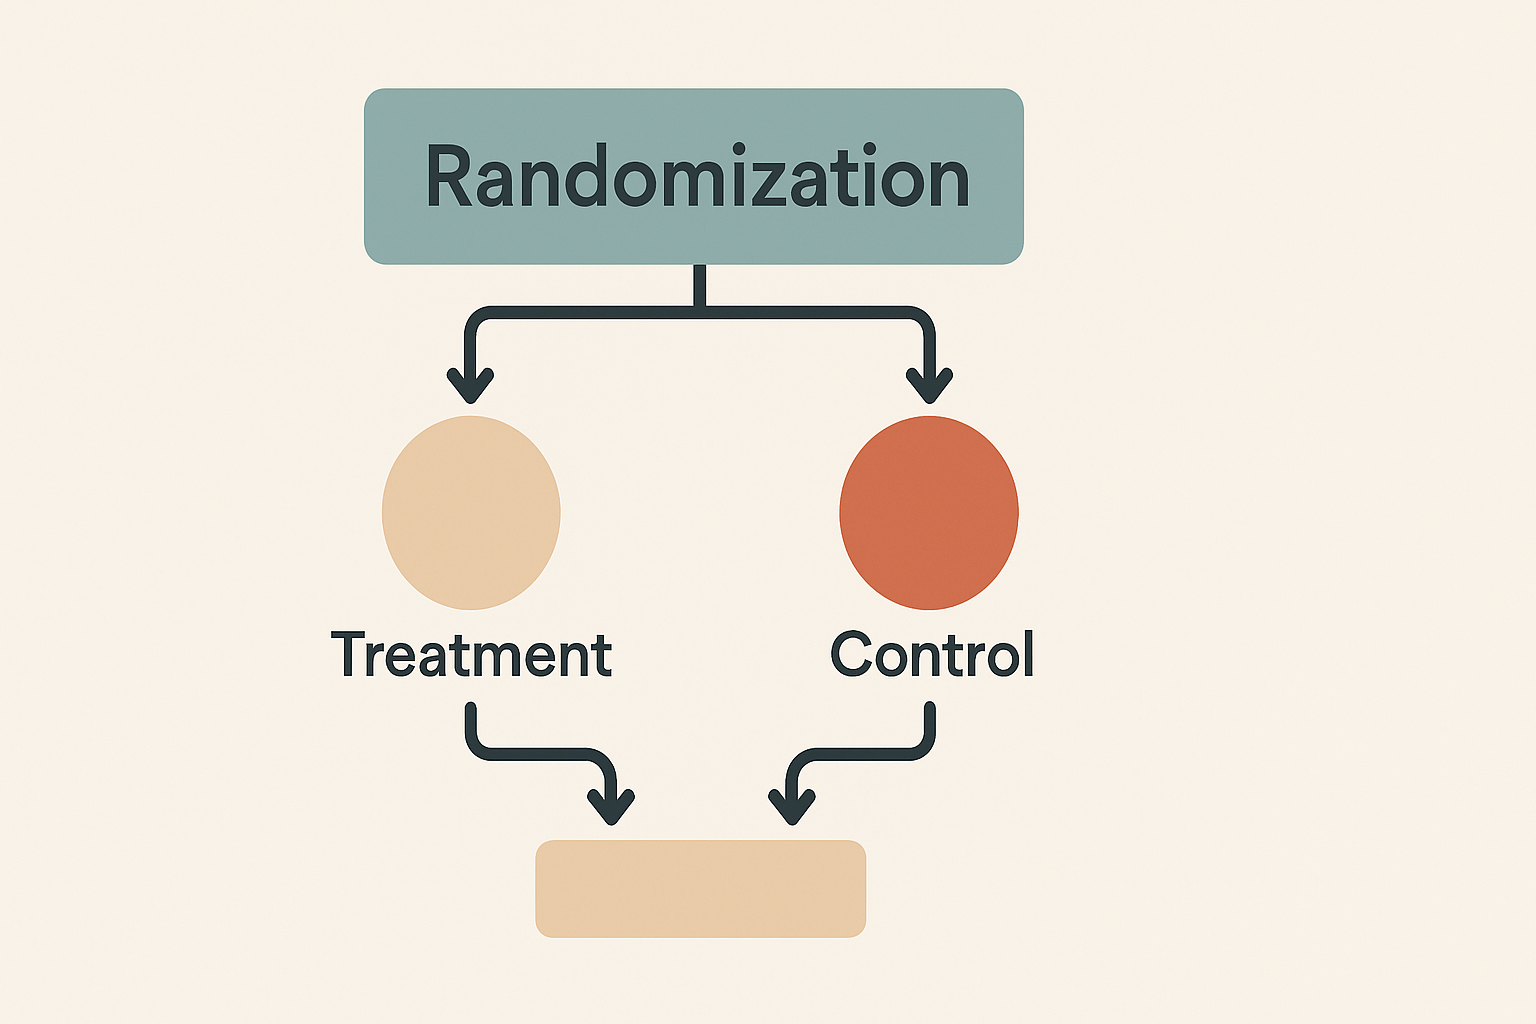
Randomized trials minimize confounding by random allocation; internal validity hinges on allocation concealment, blinding, prespecified outcomes, and complete follow‑up. CONSORT checklists flag missing or unclear elements [3].
Observational studies estimate associations when trials are impractical or unethical; causal inference relies on design quality and control for confounding. STROBE guides transparent reporting [3].
Diagnostic accuracy studies quantify how tests change probability of disease; STARD promotes complete reporting; QUADAS‑2 helps readers judge risk of bias and applicability [8,10,14].
Guidelines and recommendations should explicitly rate certainty of evidence and strength of recommendations (e.g., GRADE) [5,11].

Internal validity: reading methods like a detective
When skimming methods and results, use a two‑pass filter:
- Red flags to triage out early
- No protocol/registration for trials or reviews (CONSORT/PRISMA expectation) [1,3].
- Unclear allocation concealment or heavy post‑randomization exclusions (risk of selection or attrition bias) [3–4].
- Outcomes appear added after data collection (HARKing) or there’s flexibility in analyses that maps to significant results only (p‑hacking) [18–19].
- Non‑randomized intervention studies without confounder control or with inappropriate model choice (consider ROBINS‑I) [12].
- If it passes triage, appraise with a structured tool
- RoB 2 for randomized trials across domains (randomization, deviations from intended intervention, missing data, outcome measurement, selection of reported result) [11].
- ROBINS‑I for non‑randomized interventions [12].
- AMSTAR 2 for systematic reviews (e.g., protocol, search quality, duplicate selection, risk of bias, synthesis methods, publication bias) [7,13].
- QUADAS‑2 for diagnostic accuracy [14].
These instruments sharpen judgment and make your appraisal reproducible.
Effect estimates, uncertainty, and clinical meaning
Effect size beats p‑value. Reported p‑values test compatibility of data with a model; the ASA warns against dichotomizing evidence by p<0.05 and urges emphasis on estimates with intervals and context [16–17]. Prefer:
- Risk difference (absolute risk reduction, ARR): event rate control minus event rate treatment; tells you the extra patients helped or harmed per 100 treated [4,21].
- Relative risk (RR) and odds ratio (OR): useful, but can over‑ or understate effects depending on event frequency; always pair with absolute measures [4,15].
- Number needed to treat/harm (NNT/NNH): NNT = 1/ARR (round up); intuitive when baseline risk is clear [21].
- Hazard ratios: time‑to‑event contexts; still interpret with absolute risks when possible.
Worked example (therapy):
Control event rate (CER) 10%; treatment event rate (EER) 6%.
ARR = 10% − 6% = 4% (0.04); NNT = 1/0.04 = 25 patients treated to prevent one event [21].
Clinical significance vs statistical significance: A “significant” RR with a trivial ARR may not matter to patients. Many journals and the ASA encourage moving beyond a single threshold to consider effect sizes, uncertainty, prior evidence, and patient values [16–17].
Diagnostic accuracy & Bayes for everyday decisions
Key definitions
- Sensitivity: probability a test is positive in disease (true positive rate).
- Specificity: probability a test is negative without disease (true negative rate).
- False positive / false negative: the misclassified results that sensitivity/specificity don’t capture simultaneously.
- Predictive values (PPV, NPV): depend strongly on pretest probability (prevalence in your setting).
- Likelihood ratios (LR+ and LR−): combine sensitivity and specificity; move from pretest to post‑test probability via Bayes (or a Fagan nomogram). LR+ >10 or LR− <0.1 often yields large, practice‑changing shifts [20,22].
Quick 2×2 logic
True disease (D+) vs no disease (D−) crossed with test+ vs test− gives four cells (TP, FP, FN, TN).
Sensitivity = TP/(TP+FN); Specificity = TN/(TN+FP); LR+ = Sensitivity/(1−Specificity); LR− = (1−Sensitivity)/Specificity [20,22].
CEBM offers concise primers and LR rules of thumb to speed decisions [20,22].
Bias: what it is, how to spot it, and why it matters
Bias is any systematic deviation from the truth. Common families:
- Selection bias (e.g., inadequate allocation concealment, selective enrollment).
- Performance/detection bias (unblinded care or outcome assessment).
- Attrition bias (differential loss to follow‑up).
- Reporting bias (selective outcome reporting and publication bias) [4,9].
Catalogs and methods papers discuss dozens more (e.g., confounding, immortal time, misclassification, collider bias) and explain mechanisms and fixes (protocols, prespecification, registries, blinding, ITT analysis, robust causal models) [5,9,25].
Two influential problems to recognize quickly: - HARKing (hypothesizing after results are known): post‑hoc stories masquerading as a priori hypotheses [18].
- p‑hacking: flexible decisions in analysis or stopping rules inflate false positives; simulations show nominal 5% Type I error can balloon dramatically under undisclosed flexibility [19].
Syntheses & heterogeneity: when evidence conflicts
Meta‑analyses pool multiple studies to improve precision, but heterogeneity matters:
- Statistical heterogeneity is often summarized by I², the proportion of variability due to real differences rather than chance; interpret cautiously when few studies are available (I² is biased with small k) [25–26].
- Fixed/common‑effect vs random‑effects models: fixed assumes one true effect; random estimates a distribution of effects across studies; the choice should reflect the question and heterogeneity, not a default [25,27].
- Explore clinical (population, intervention, comparator, outcomes) and methodologic sources (risk of bias), and consider prediction intervals when appropriate [4,25].
From evidence to recommendations: certainty and strength
The GRADE approach rates certainty of evidence across outcomes (high, moderate, low, very low) considering risk of bias, inconsistency, indirectness, imprecision, and publication bias; recommendations are then rated for strength with explicit trade‑offs, values, and resource considerations [5,9,11]. USPSTF grades similarly emphasize magnitude of net benefit and certainty [18].
How to Read Research Articles
Follow this reproducible, clinic‑ready workflow:
- Clarify the clinical question using PICO (patient/problem, intervention, comparator, outcomes).
- Find best sources first: recent systematic reviews/meta‑analyses; if none, look for high‑quality RCTs, then well‑designed observational studies; check trial registries for ongoing or unpublished data [1,4,11–12].
- Quick triage (title/abstract): Is the design appropriate for the question? Are outcomes patient‑important? Is there preregistration?
- Method check with the right tool:
- RCT → CONSORT + RoB 2 [3,11]
- Nonrandomized intervention → ROBINS‑I [12]
- Systematic review → PRISMA + AMSTAR 2 [1,7,13]
- Diagnostic accuracy → STARD + QUADAS‑2 [10,14]
- Effect interpretation: Extract absolute and relative effect sizes with 95% CIs; compute ARR and NNT/NNH when possible; don’t stop at p < 0.05 [16–17,21].
- Assess applicability: Patients like yours? Setting similar? Comorbidities and adherence realistic? Harms and patient preferences discussed?
- Synthesize & decide: Place the new study into existing evidence (Cochrane/USPSTF/AHRQ). If results are discordant, look for heterogeneity explanations and certainty ratings (GRADE) [4–5,18,24].
- Document your appraisal: Keep a brief critical appraisal note (tool used, key risks of bias, effect sizes, certainty, and your bottom line).

Risk math, made simple for the ward
Absolute vs relative risk. Relative measures (RR, OR) can look impressive; absolute risk difference (ARR) often tells the real story. For counseling:
- ARR = CER − EER
- NNT = 1/ARR; NNH = 1/absolute risk increase (ARI) [21].
- Always anchor to baseline risk: the same RR yields very different ARRs if baseline risk is 2% vs 20% [4,21].
Use a quick sketch of 100 stick‑figures: with a 4% ARR, 4 fewer events per 100 treated concrete and memorable.
Reporting standards you can lean on
- CONSORT (trials), PRISMA (systematic reviews), STROBE (observational), STARD (diagnostic), plus strength‑of‑evidence frameworks like GRADE. These make missing pieces visible during appraisal and speed teaching [1–5,10].
- CASP checklists: practical one‑page prompts for multiple designs, great for journal clubs and precepting [29–31].
Practical search tips (5 minutes to better PubMed)
- Use MeSH terms plus keywords; explode narrower terms selectively [14].
- Apply filters (e.g., Article type: RCT, Systematic Review; Humans; Adult).
- Scan Similar articles and Cited by to map a literature cluster [13].
- Cross‑check Cochrane, TRIP, Epistemonikos for syntheses and guideline‑grade summaries [4,16–17,20].
Ethics and transparency cues
- Trial registration at or before first participant is an ICMJE requirement; match registry outcomes to published outcomes to detect selective reporting [11].
- Funding and conflicts: read disclosures; industry funding doesn’t automatically invalidate a study, but it changes your prior and scrutiny.
- ClinicalTrials.gov postings: helpful, but some records may be non‑rigorous—appraise design and oversight carefully [12].
Teaching & team implementation
- Run monthly journal clubs with a rotating study‑type theme and the matching appraisal tool (RoB 2, ROBINS‑I, QUADAS‑2, AMSTAR 2).
- Create clinic‑specific evidence notes: 8-10 lines capturing PICO, effect sizes, certainty, and bottom line.
- Build a shared library of the best reviews and guidelines for your top 20 clinical questions.

Key Takeaways
- Prefer effect sizes with confidence intervals and absolute measures over p‑value thresholds [16–17,21].
- Use the right tool for the design (CONSORT/PRISMA/STROBE/STARD + RoB 2/ROBINS‑I/AMSTAR 2/QUADAS‑2) to make bias visible [1–3,7,10-12,14].
- Consider heterogeneity and applicability before changing practice; lean on GRADE and reputable bodies (Cochrane, USPSTF, AHRQ) for synthesis and certainty [4–5,18,24].
- For diagnostics, think pretest → likelihood ratios → post‑test; prevalence drives predictive values [20,22].
References
Reporting Standards & Methods
[1] “The PRISMA 2020 statement: an updated guideline for reporting systematic reviews,” BMJ, 2021.
[2] D. Moher et al., “CONSORT 2010 Explanation and Elaboration,” BMJ (2010) [PMC].
[3] “STROBE: guidelines for reporting observational studies,” EQUATOR Network, 2025.
[4] “Cochrane Handbook for Systematic Reviews of Interventions,” Cochrane, 2024.
[5] “Overview of the GRADE approach,” GRADEpro Handbook, 2025.
Risk of Bias & Appraisal Tools
[6] “RoB 2: revised Cochrane risk‑of‑bias tool for randomized trials,” Cochrane Bias Methods Group, 2019–2021.
[7] “ROBINS‑I: risk of bias in non‑randomized studies of interventions,” Cochrane Bias Methods Group, 2016–2024.
[8] B. J. Shea et al., “AMSTAR 2: a critical appraisal tool for systematic reviews,” BMJ (2017).
[9] P. F. Whiting et al., “QUADAS‑2: quality assessment of diagnostic accuracy studies,” Ann Intern Med (2011).
[10] J. F. Cohen et al., “STARD 2015 guidelines for reporting diagnostic accuracy studies,” BMJ Open (2016).
Registries, Databases & Searching
[11] “ICMJE Clinical Trial Registration,” ICMJE Recommendations, 2024–2025.
[12] “About ClinicalTrials.gov,” U.S. NIH/NLM, 2024.
[13] “PubMed Help,” NLM/NIH, 2025.
[14] “Medical Subject Headings (MeSH) – Home,” NLM, 2025.
[15] “TRIP Medical Database,” TRIP, 2025.
[16] “Epistemonikos: Database of evidence‑based health,” Epistemonikos, 2025.
Statistics, Interpretation & Bias Concepts
[17] American Statistical Association, “Statement on Statistical Significance and P‑Values,” ASA (2016) [PDF].
[18] R. L. Wasserstein et al., “Moving to a World Beyond p < 0.05,” The American Statistician (2019).
[19] J. P. Simmons et al., “False‑Positive Psychology,” Psychol Sci (2011).
[20] R. Matthews, “The p‑value statement, five years on,” Significance (2021).
[21] “Likelihood Ratios,” Centre for Evidence‑Based Medicine (CEBM), University of Oxford, 2024–2025.
[22] “Number Needed to Treat (NNT),” CEBM, University of Oxford, 2025.
[23] “Chapter 10: Analysing data and undertaking meta‑analyses,” Cochrane Handbook, 2019–2025.
[24] P. T. von Hippel, “The heterogeneity statistic I² can be biased in small meta‑analyses,” BMC Med Res Methodol (2015).
U.S. Evidence Synthesis Bodies & Methods
[25] “Grade Definitions & Certainty,” USPSTF Methods, 2025.
[26] “Methods Guide for Effectiveness and Comparative Effectiveness Reviews,” AHRQ EPC (NCBI Books), updated.
Appraisal Aids & Teaching Resources
[27] “CASP Checklists,” Critical Appraisal Skills Programme, 2024–2025.
[28] “Users’ Guide to the Medical Literature (collection),” JAMA, 2022–2025.
Recommended Video (YouTube)
[29] “JAMAevidence: Users’ Guides to the Medical Literature” (playlist), JAMA Network, 2025.